Teacher guideTracking progress
Tracking progress

Reading your Teacher Dashboard: what every number counts

A tile-by-tile guide to a class in your Teacher Dashboard: what each number counts, over what window, and exactly what a student has to do to move it.

Kind
Overview
Reading time
7 minutes
Last updated
September 24, 2026
Where
Teacher portal, All Classrooms, then the class name
Who is counted
Students who have joined. Pending invitations are not in the tiles
Refresh
Tiles and roster reload every time you open the page
Book numbers
Reading and chapter figures appear only when a textbook is attached

A class in your Teacher Dashboard opens on a dark band of tiles (six when the class has a textbook attached, five when it does not), then three tabs: Needs you, the review queue, By student, the roster, and By chapter, a card per chapter. Each number answers a different question, and one or two of them count something narrower than their label suggests. This page takes them one at a time.

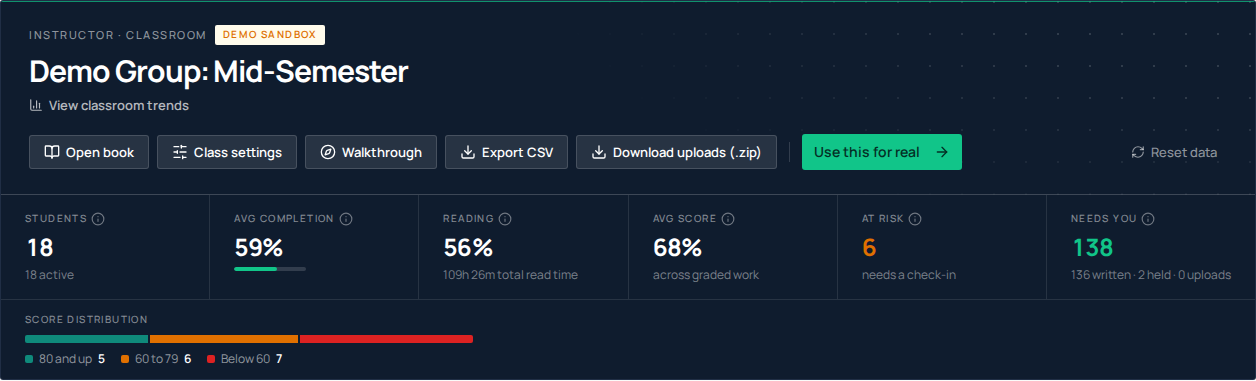
The dark classroom hero band showing six tiles: Students, Avg completion, Reading, Avg score, At risk and Needs you, each with a small information icon.
Every tile carries an information icon. Where a hint and this page disagree, this page is the one checked against the code.

Who the numbers are about

Every tile counts students who have joined the class. A student joins when they accept your email invitation, when they enter your class code at /join, or the moment you create an account for them with Create accounts, a created account is on the roster straight away, before the student has ever signed in. Adding an email address that already has an account joins that person immediately too, but only once your own teacher account has been approved; while approval is pending, every invitee gets an emailed invitation instead.

A pending invitation counts nowhere in the tiles. Invitations do appear in the roster on the By student tab, and the count in its heading includes them, which is the one place the two figures differ. Numbers that come from the book (the Reading tile, the reading columns, the chapter breakdown) appear only when a textbook is attached to the class. Removing a student takes them out of every number here; their own progress and Points history are kept, on their own Achievements & Points page.

The tiles across the top

Students

How many students have joined. The line beneath restates the same figure as active, the two are always identical, so read it as a label rather than a second number. If you invited twenty people and twelve have joined, this reads 12 while the roster heading reads 20.

Avg completion

Chapters completed divided by the number of chapters in the book, averaged across every joined student, including students who have done nothing, who count as zero. A chapter counts once three things are true: the student has read it through, ticked off every self-attest hands-on step in it, and passed its checkpoint quiz with 80 percent or better. That is the same verdict the reader shows the student at the end of the chapter, so this tile and what your class sees agree. In the reader those checkpoints are labelled Practice quiz. A chapter with no steps or no quiz simply needs the parts it has, and a later failed retake never takes a completion away. Smart-graded QuickBooks uploads move neither Completion nor Score; that is by design, because plenty of readers work through the book without a QuickBooks Online account of their own.

Reading

This tile only appears when the class has a textbook, and it carries two facts. The percentage is how far into the book the class has read on average, measured from the furthest page each student has reached, as a share of the whole book, averaged across joined students. The line underneath is measured reading time added up across the whole class, not an average per student, so a class of thirty racks up large totals quickly.

Avg score

Each student's mean score on the graded work they have submitted for this class's book, averaged across joined students. That means their best result on each chapter checkpoint quiz, plus any chapter exams. Repeat attempts at a checkpoint do not pull the mean down, because only the best one counts. When nobody has submitted anything, the tile shows a dash rather than zero.

At risk

A count of students who meet both conditions: under 50 percent complete and no activity for 14 days or more. Activity is anything a student does here: reading, a quiz or exam attempt, a graded upload, a sign-in. A student who has never done anything counts as inactive. One condition on its own is not enough. A student who is behind but was reading yesterday is not flagged, and neither is a quiet student who is 80 percent through.

Needs you

Work waiting on you: written answers your Answers to review setting asks you to read, QuickBooks grades held for your release, and uploads whose latest try could not be read. The line beneath splits it by kind. The Needs you tab below lists every one, and the same count sits beside the class in the left sidebar.

The By student tab, column by column

ColumnWhat it counts
StudentName, email, and badges, At risk, Invited, or Awaiting approval while your teacher account is still being verified.
ReadingHow far into the book this student has read, from the furthest page reached, so looking back never takes progress away. Not graded.
QuizzesThe practice quizzes: the multiple choice alone, on the student's best attempt, the same figure their reader shows them. Written questions are never marked.
ExamsChapter exams, best sitting. The graded line, and the only number an adjustment lands on.
Smart graderTheir QuickBooks work, scored on the best submission. Anything held for you or that failed to upload shows as work owed.
CompletionThat student's own chapters-finished percentage, on the same rule as the tile.
Needs youHow many of this student's items are waiting in your Needs you tab.
GradeThe grade on record once you set one; until then the suggested blend of score, completion and participation, labelled Suggested.
Last loginTheir most recent sign-in. For a student still on an invitation, this shows when the invitation went out instead, or Not sent yet. Wide screens only.

Click a column heading to sort, and use the chips above the table (All, Active, Not joined, At risk, Top performers) to filter. View progress on a row opens that student's record; a row that is still an invitation has nothing to open yet. Manage roster adds and removes students, and Manage seats opens your seats. Written answers, held grades and failed uploads are not on this tab: they wait in Needs you, and reading an answer is feedback for the student, not a change to anyone's score.

The By student roster: filter chips, then columns for Student, Reading, Quizzes, Exams, Smart grader, Completion, Needs you and Grade, one row per student.
Reading and Completion answer two different questions about the same student.

The chapter breakdown

The quick chapter view is the By chapter tab: a card per chapter with bars for Read, Quiz, Exam and Grader, how many students have opened it, and an N need you badge when work in that chapter is waiting on you. The detailed version lives in Classroom trends, opened from View classroom trends under the classroom's name, as the Chapter completion breakdown: one row per chapter, split into green for completed, amber for in progress, grey for not started. Those buckets come from the same chapter record as Avg completion. Amber means the student has started the chapter, reached it in the reader, without yet finishing all three requirements, usually a checkpoint quiz not yet passed at 80 or a few hands-on steps left unticked. A student who is halfway through reading chapter 4 sits in amber. Grey means they have not reached the chapter at all. Hover a segment to see which students are in it, and select a name to open them.

View classroom trends, the small link under the classroom's name, opens Classroom trends, the wider view, on a page of its own. Its top strip shows six cards: Students, Active this week, Active this month, Avg completion, Avg score and At risk. Students, Avg completion and At risk follow exactly the rules above. Active this week and Active this month count students who did something in the last 7 or 30 days: opened the book, answered a quiz, submitted work, or signed in. They are not sign-in counts; a sign-in lasts 30 days, so a student working daily may sign in about once a month. Avg score follows the same per-student rule as the dashboard tile, with one difference worth knowing: the dashboard averages across every joined student and counts a student with no graded work as zero, while this card averages only the students who have submitted something, so the two can disagree on a class where several students have not started. It also prints 0% rather than a dash when nothing has been submitted.

Below that are up to four charts; the last two only appear once there is data behind them.

  • Score distribution: how many students sit in each score band, one count per student, drawn from each student's average score and banded at 80 and 60, like every score on the page. A student who retook a quiz is counted once.
  • Weekly active students: distinct students who did something in each week (reading, quiz or exam attempts, submitted work, or a sign-in), over the last eight weeks. A week with nobody active plots as zero rather than being skipped, so a flat stretch is real silence.
  • Class completion over time, one point for each week in which somebody completed a chapter, counting the students who completed at least one that week and scaling it to the class and to one chapter's share of the course. Read it as pace rather than a running total; a student who clears two chapters in one week is still counted once.
  • Chapter completion breakdown: the chapter-by-chapter view described above, at full height.

Two tables sit under the charts. Top performers ranks your five highest mean scores and shows each one's completion beside it, which is why a top scorer can sit at 40 percent done. At-risk students lists the same students the tile counts, with their completion and last sign-in date. The textbook reading panel is last on the page.

The At-Risk Students card on the Classroom trends page, listing flagged students with a red completion percentage and their last login date.
The tile gives you a count; this card gives you the names and the date each one was last seen.

Points and streaks, and their own flag

Further down Classroom trends sits the Points view: total class Points, average level, streaks, badges, a 14-day activity chart, and a sortable per-student table. Two things there are defined differently from the rest of the portal. Active this week counts students who earned Points in the last 7 days, not students who signed in, despite a hint on that card that says otherwise. And when anyone qualifies, an amber banner flags students who have earned no Points in 7 or more days, which is a different test from the dashboard's At risk.

Two definitions of at risk, and when each one helps

FlagWhere it appearsThe ruleBest used for
At riskDashboard tile, Classroom trends, roster badgeUnder 50% complete AND no activity of any kind for 14+ daysMid-term and end-of-term triage: who is genuinely behind and gone
No Points in 7+ daysPoints view banner and amber table rowsNo Points earned in the last 7 days, or none everWeek-to-week check-ins. Who went quiet recently, before they fall behind

The completion flag is deliberately slow. It waits for two weeks of silence and real evidence of falling behind, so it stays small enough to act on. The Points flag is fast and will name more students, including people who are fine and took a week off. If you run a weekly check-in, the Points list will find people first. If you are deciding who needs a conversation before the exam, trust the At risk flag.

What the Progress tracking switch actually does

Numbers that look wrong and are not

  • A dash instead of 0%. Score shows a dash when there is nothing to average, and also when a student's only submitted attempt scored zero.
  • A finished student below 100%. Look for a checkpoint quiz not yet passed at 80 or an unticked hands-on step somewhere; their own page shows which chapter is still In Progress. A class that genuinely finishes every content chapter reads 100 percent.
  • Completion at 0% while the class is clearly working. It moves a whole chapter at a time, so an early class may genuinely have finished none. Reading is the tile that moves continuously.
  • Avg score differs between the dashboard and Classroom trends. Both read the same per-student averages, but the dashboard counts a student with no graded work as zero while Classroom trends leaves them out of the average.
  • Smart-graded work counted before you release it. When smart grading is switched off for the class, the grader's verdict is still recorded at upload and shows in the roster's QBO cell straight away. The student sees nothing until you release it, so the roster can be ahead of what the class knows.
  • Nothing changed after you hid chapters. Hiding changes what the class sees in the reader, not the completion denominator.
  • Everything at zero on a class with no textbook. With no book attached there are no chapters to divide by, so completion is 0% for everyone and the reading numbers are absent.

The tiles and the roster reload every time you open the class from All Classrooms. The chapter breakdown, the Needs you count and the Points figures are cached for up to a minute, and nothing refreshes on its own (not even when you switch back to the tab), so reload the page if you are watching work land during a lab session.

Quick answers

Questions we get about this

Why is average completion low when my students have read most of the book?
Completion counts whole chapters a student has finished (read through, hands-on steps ticked, checkpoint quiz passed), so it moves in chapter-sized jumps rather than continuously. A class midway through chapter four may have finished nothing yet. Use the Reading tile and the Reading column to see how much of the book the class has actually read.
Do the tiles include students I invited who have not joined yet?
No. Every tile counts students who have joined. Pending invitations appear as rows in the By student roster with an Invited badge, and the count in its heading includes them, so that heading can be higher than the Students tile.
Does a student's work in another teacher's class show up in my numbers?
Not when your class has a textbook attached: graded scores are limited to that book's checkpoint quizzes and assessments, and smart-graded QuickBooks work is attributed to the class it was submitted in. A group with no textbook attached has nothing to scope to, so its score figures are not filtered by course. And if two of your own classes use the same book, a student enrolled in both will show the same assessment score in both.
What counts as in progress in the chapter breakdown?
A student who has started the chapter without finishing it: they have reached it in the reader, but have not yet read it through, ticked every hands-on step, and passed its practice quiz at 80 or better. Only a student who has not reached the chapter at all sits in not started.
Does turning off Progress tracking stop the dashboard counting?
Yes. With it off, the reader stops saving reading position, reading time, annotations and checkpoint results for that class, so the tiles that depend on them go quiet. It is the first thing to check when a class that is clearly working shows nothing. Turning it back on resumes recording from that point. The gap is not backfilled.
Still stuck

Ask us directly.

A real person on our team reads every message and replies within one to two business days. If something in your classroom is not behaving the way this guide describes, tell us. That is a bug, and we want it.